Visualizations: Diagrams, Maps, and Flows
 About the Projects
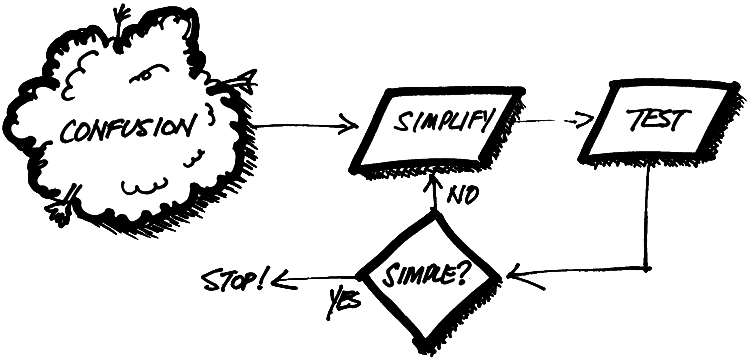
A visualization reveals the core of a subject – be it a complete system or a single experience. It reduces complexity to the simplest form that is still meaningful.
Describing systems and experiences
When we document UX, we describe systems and experiences. We visualize the connections among people, places, and things. Understanding these visualizations becomes a matter of fidelity.
Fidelity is the degree of sameness between two things. A high-fidelity document mirrors a future experience, whereas a low-fidelity one merely references it. To understand an experience, we need only reach a level of fidelity that communicates what is necessary at any given moment.
Example visualizations
Here are several examples of purely visual examples* with varied fidelity. The documents show how people relate to systems, how ecosystems drive engagement, and how companies exchange data.
* Please refer to other case studies on this website for a more thorough analysis of past work.
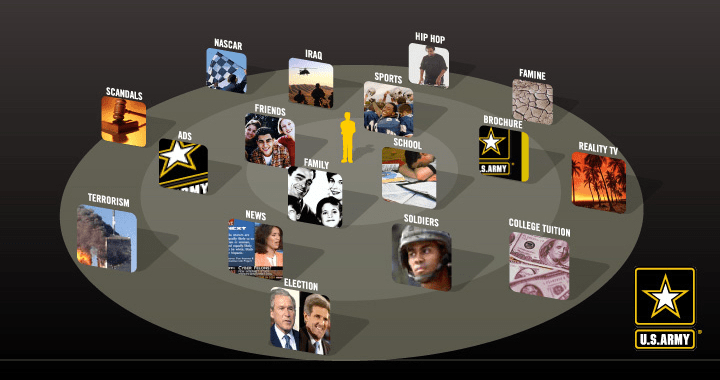
Diagram of the societal influences affecting applicants for the US Army
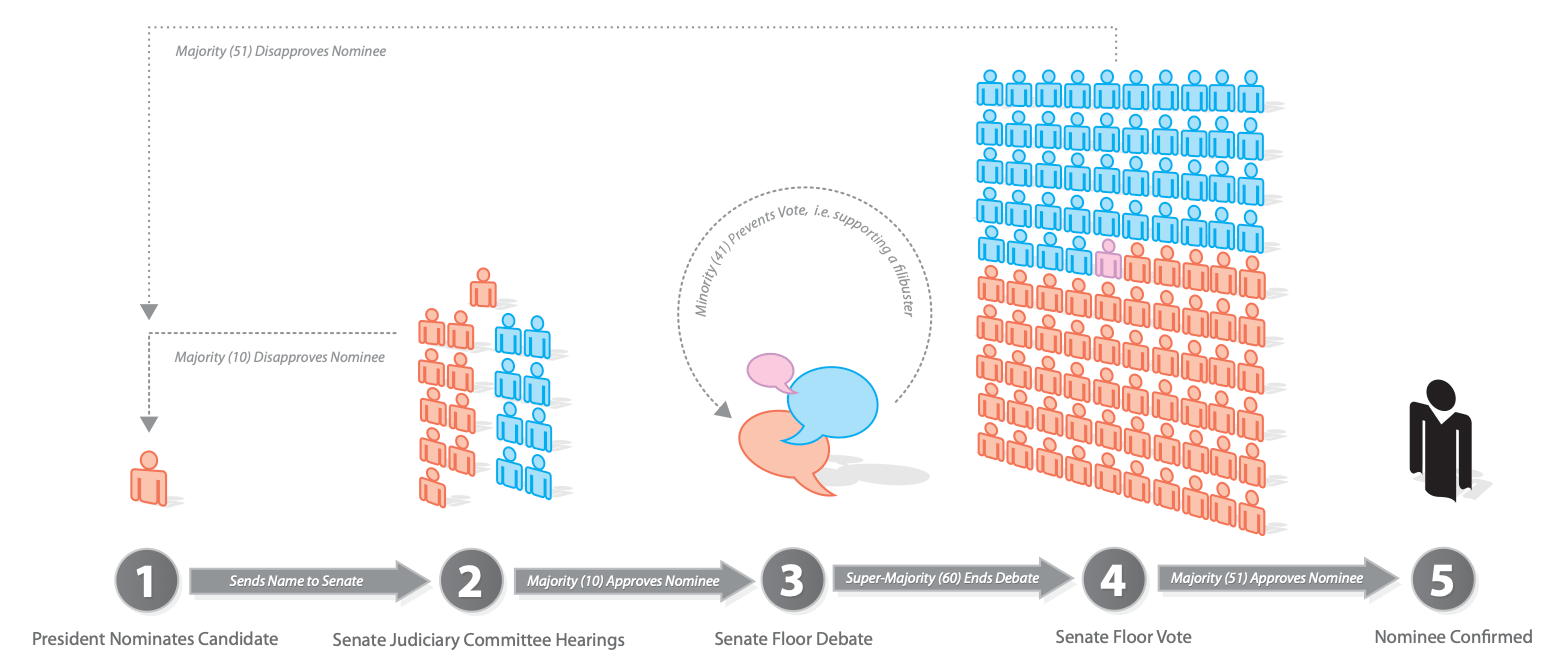 Supreme Court appointment process (simplified)
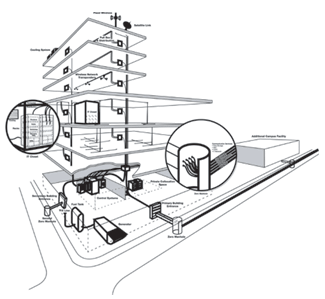 Technical illustration of a building's telecommunication infrastructure for a commercial building operator
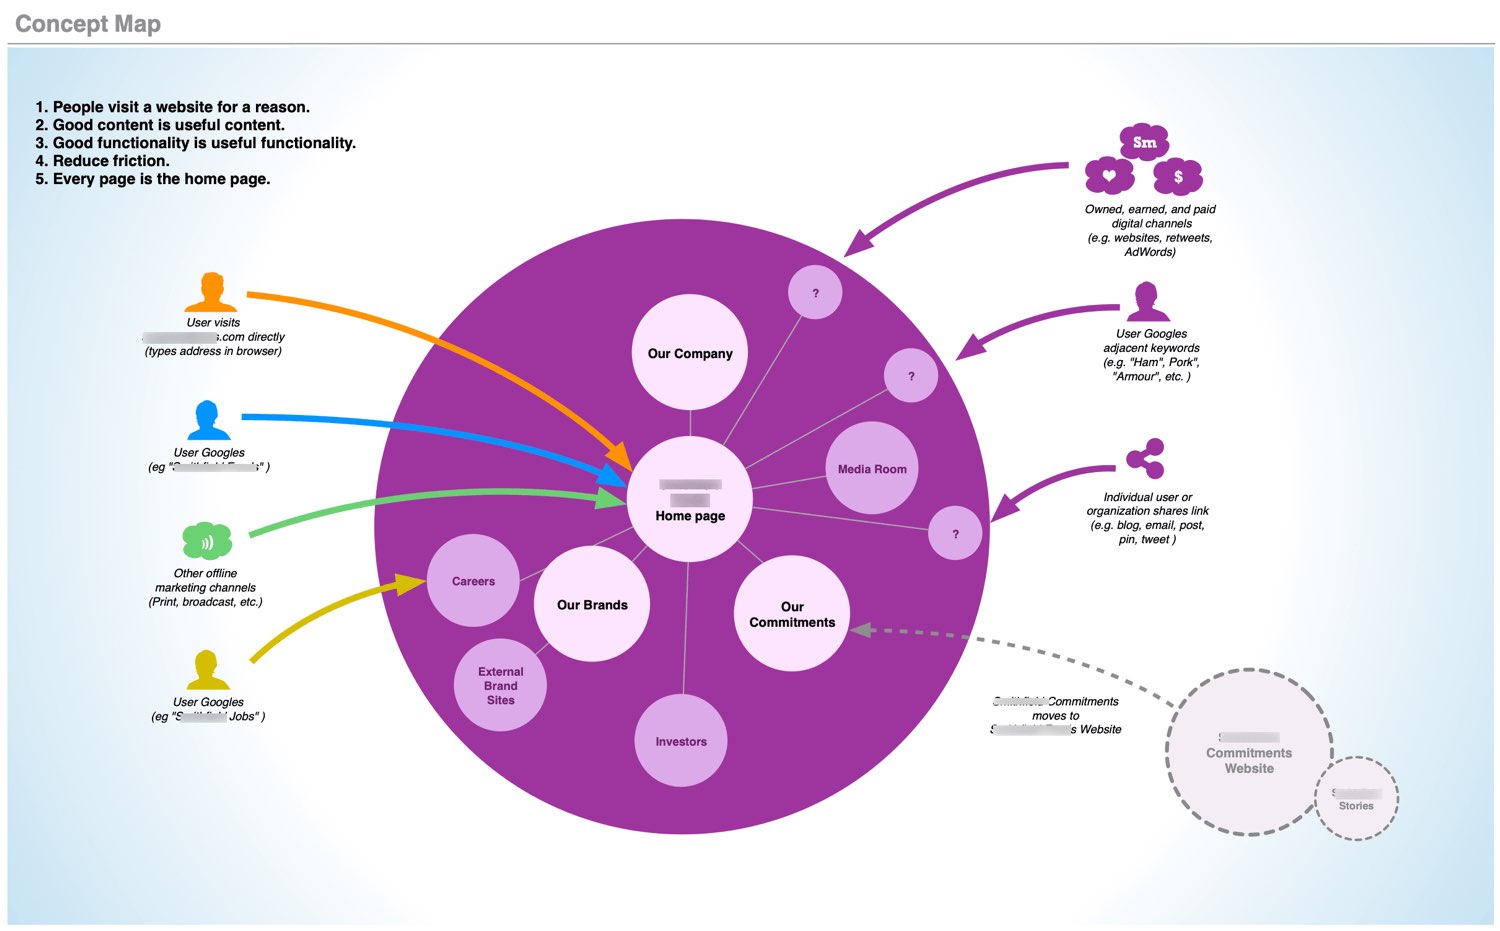 Digital ecosystem diagram for a national consumer packaged goods company
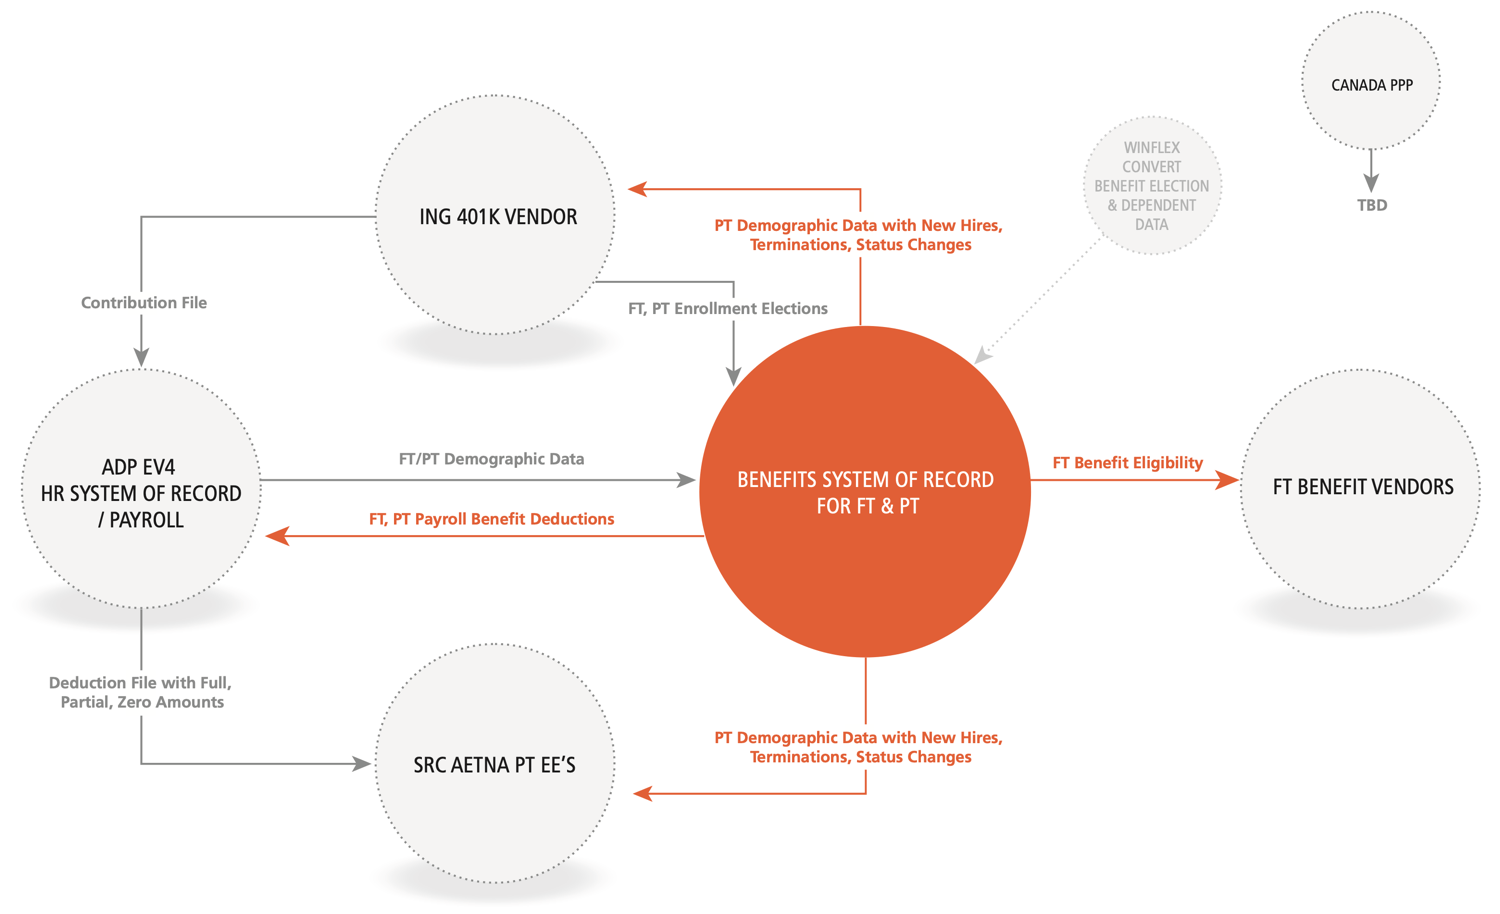 Electronic data interchange (EDI) feed diagram for an employee benefits firm
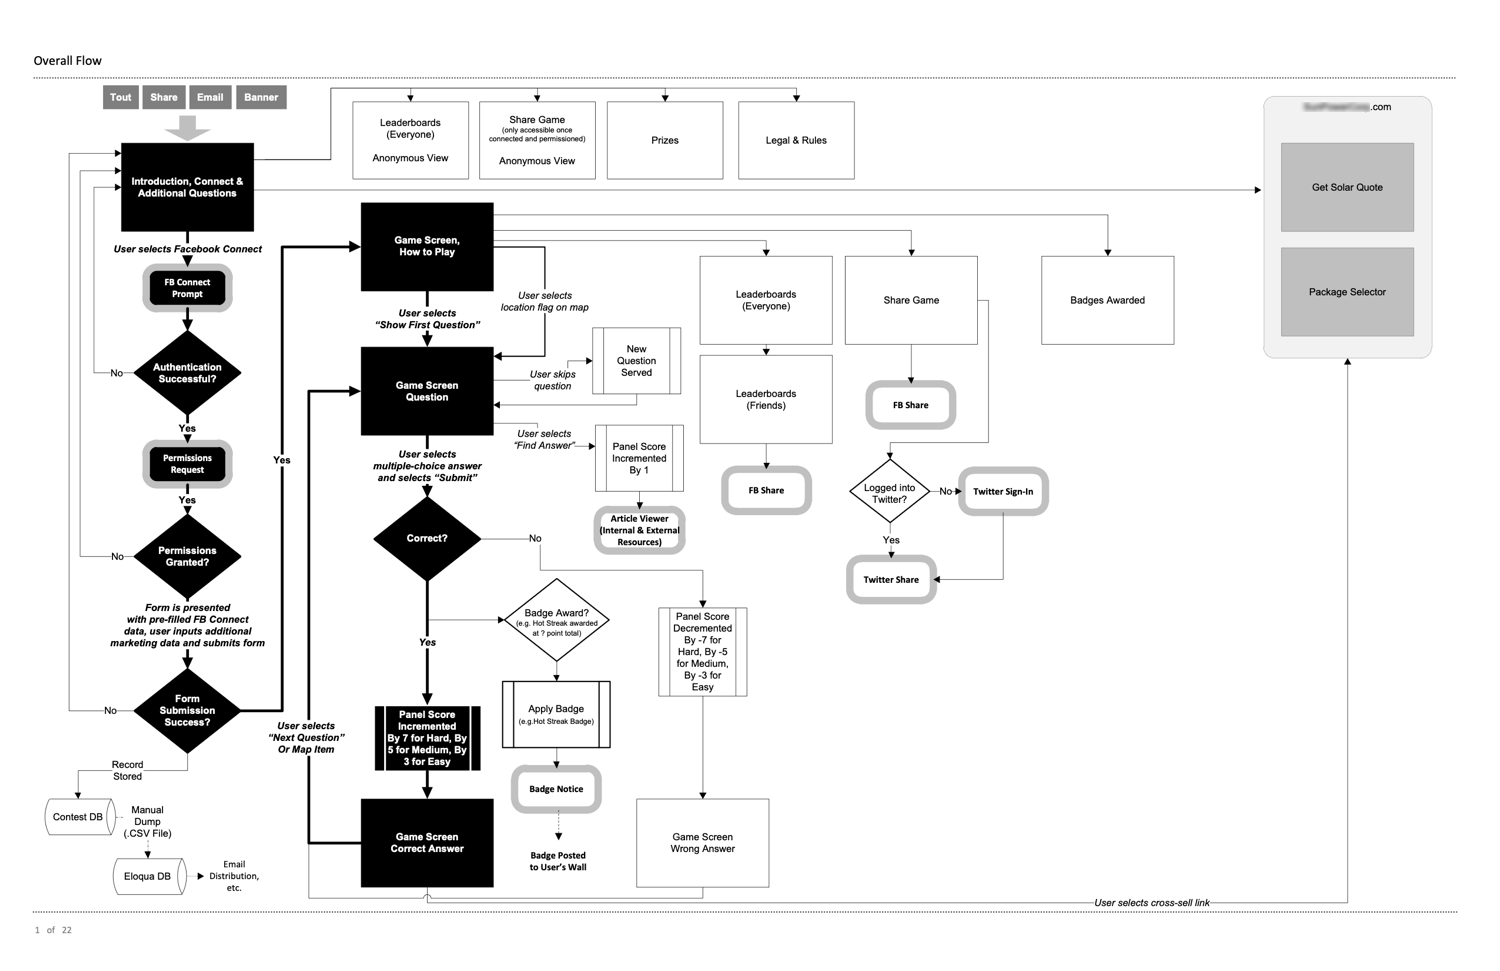 Process flow for social game and lead generation tool for a multinational solar manufacturer