OJT App: Mixed Methods Research and UX Strategy
 The challenge
How might a global manufacturer provide on-the-job training (OJT) to commercial roofers?
 About the Project
All apps require a deep understanding of users, but even more so when those people are literally balancing multiple tasks and concerns -- sometimes hundreds of feet in the air. Safety. Cost. Efficiency. With many potential tasks, we set out to discover the top ones a user would perform when working with complex roofing systems.

Mixed Methods
Mixed methods research combines qualitative and quantitative approaches. It provides both the "what" and "why" of observable phenomena. Mixed methods research often begins with in-depth qualitative interviews or contextual inquiries. These qualitative methods surface tasks to subsequently analyze through quantitative means, such as through surveying.

Tasks
Participants
Top tasks
Resulting prototype
Top Task Analysis
Top Task Analysis is a form of mixed methods research. It helps an organization focus on what matters -- the tasks that participants feel are most important to complete their goals. We posed several questions to participants. We paired each question with a large collection of tasks to choose among (e.g. “Learn about hand welding”). The tasks were based on extensive document reviews and numerous interviews with the client’s team members.
 Several of the interview participants (portraits intentionally blurred)
We surveyed several hundred participants, encompassing multiple business units and support services. The resulting research provided us a clear delineation between higher- and lower-prioritized tasks. Higher-prioritized tasks were shared among many participants, whereas lower-prioritized tasks were distributed along a long tail. For illustration purposes only, here is the distribution of answers to our first question:
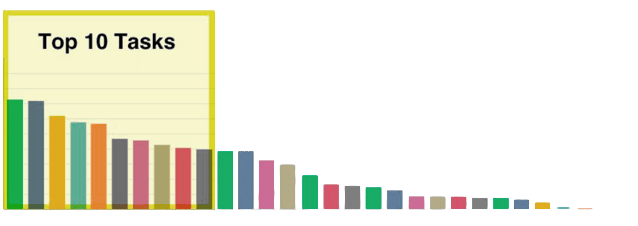 Top-10 tasks and long tail distribution
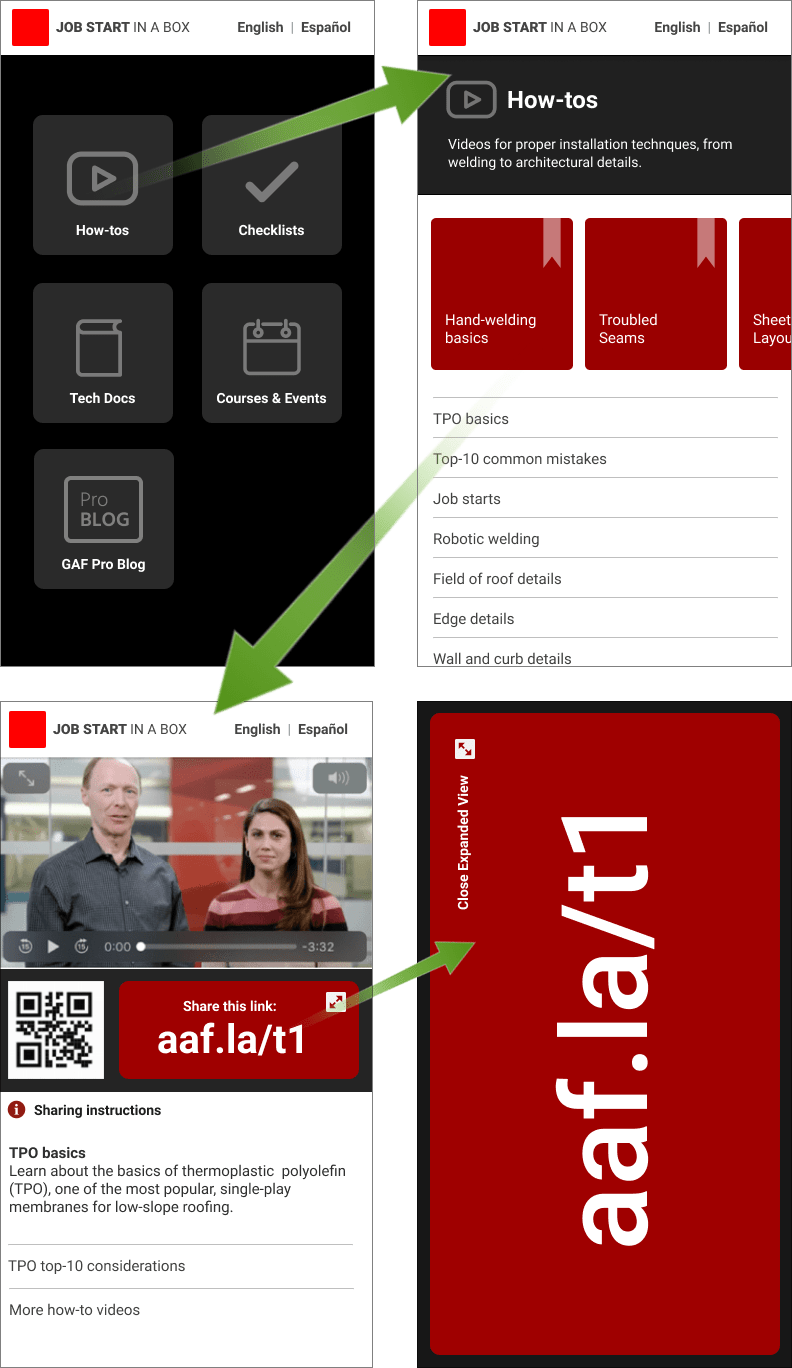 Quick mockup of resulting application, where users share links to educational videos via QR codes or expanded, high-visibility URLs ( View image )
Pairing quantitative and qualitative
A word of caution: Top Task Analysis -- and quantitative research in general -- tells us what is happening but not why it is happening. We should avoid making too many assumptions about why a phenomenon occurs without pairing quantitative results with qualitative research. Qualitative research, like the interviews performed at the beginning of the project, informs both the quantitative protocol and the resulting claims.
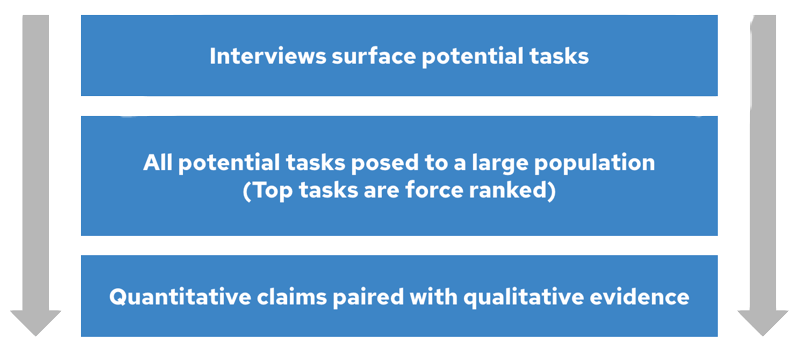 Flow of Top Task Analysis ( View image )
Revealing Priorities
This research study revealed employees’ beliefs about job starts and inspections. It showed us which tasks are the most important to know and perform. As such, we used the research to emphasize areas of focus for future products and services. For example, we focused our content creation efforts on the higher-prioritized tasks, as those tasks are the most important to know and perform. Subsequently, we filled in the gaps with lower-priority content.
The research continues to serve in longitudinal studies as well as inform product backlogs.
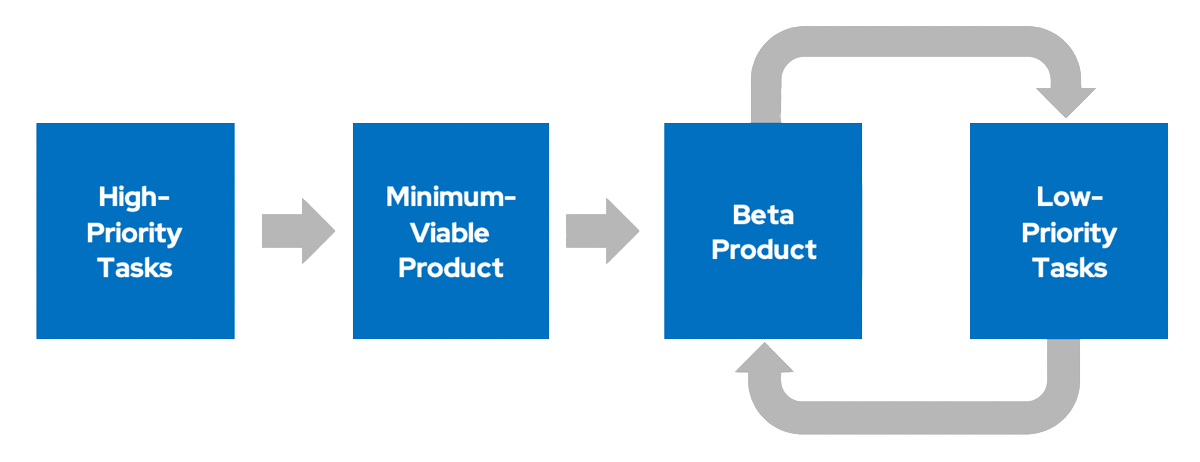 High- to low-priority task flow ( View image )
Other Notable Projects
- Qualitative research study for an innovation team that sought to understand the challenges of new contracting businesses.
- Comprehensive design research for a technology provider of institutional buyers' decision-making and purchasing habits.
- Focus group studies for a regional, multichannel media business, covering print, radio, TV, and web.
- Ethnography study for an international consulting firm of houseboat residences in Chicago.
- Design research studies for a technology provider of a nationwide learning management system (LMS).
- Analytics research for a technology provider of a nationwide educational program.
- Contextual inquiries for an international consumer package goods company (CPG) of their call center operations.